
Weight & Metabolism
BMI and Body Composition: Why the Scale Lies
Where BMI came from, when it works and when it fails, why waist-to-height ratio beats it, and how to read your body composition without expensive equipment.
15 min read
Calculate your BMI from height and weight online: a chart of the ranges for men and women, WHO Asian cut-offs and an honest account of where body mass index fails and why your waist matters more.
Updated: September 1, 2026 · 🔒 Your data never leaves your browser
Body mass index (BMI) is your weight in kilograms divided by your height in metres squared. The healthy adult range is 18.5 to 24.9; at 175 cm that means 56.7–76.3 kg. Enter your height and weight and the calculator shows your BMI and category at once. But remember: BMI cannot tell muscle from fat and knows nothing about where that fat sits, which is why waist circumference predicts risk better — it should be less than half your height.
Sex
For people of South and East Asian descent overweight starts at a BMI of 23: at the same index, body fat and diabetes risk run higher.
Circumferences — optional, but they decide the verdict
Measure in the morning, before eating, with the tape snug but not tight. Waist at the navel, hips at the widest point, neck just below the larynx.
Body mass index
Healthy range for your height: 56.7–76.6 kg. That is 1.4 kg above the upper limit
Body fat from circumferences
Add your neck and waist (and hips, for women) to estimate body fat with the US Navy method.
📋 Bottom line
Some measures are outside the healthy range. Not a diagnosis, but a reason to check blood pressure, glucose and a lipid panel at your next check-up.
BMI is a population statistic. It overstates risk in muscular people and understates it in older, sedentary ones: same mass, less muscle. None of these indices diagnose anything or replace an examination.
Once you have your number, find it in the chart. Categories follow the WHO classification for adults aged 18+; BMI is not read this way for children, adolescents or during pregnancy.
| BMI, kg/m² | Category | What it means |
|---|---|---|
| below 16 | Severe underweight | Health risk, see a doctor |
| 16.0–18.4 | Underweight | Below the healthy range |
| 18.5–24.9 | Normal | Healthy range |
| 25.0–29.9 | Overweight | Raised risk |
| 30.0–34.9 | Obesity class I | High risk |
| 35.0–39.9 | Obesity class II | Very high risk |
| 40 and above | Obesity class III | Extremely high risk |
The number alone is only a signpost: the 25–29.9 band holds both muscular people and people with a large belly and weak muscles. What your own result means is unpacked below.
The calculator produces four different numbers, and they answer four different questions.
Body mass index is weight divided by height in metres squared. It answers "how much of me is there relative to my height". Quetelet devised it in 1832 as a statistical tool for describing populations, and it was never meant as an individual measure of health.
Waist circumference answers where the fat actually sits. The absolute thresholds are 94 and 102 cm in men, 80 and 88 cm in women.
Waist-to-height ratio is the same waist adjusted for height: 90 cm means something different on a 195 cm frame and on a 160 cm one. The threshold is identical for everyone and easy to remember — keep your waist under half your height.
Body fat from circumferences is estimated with the US Navy method from neck, waist and, for women, hips. It is the only one of the four that tries to say what those kilograms are made of.
It errs in both directions, and both matter clinically.
Overstating risk in muscular people. Muscle is denser than fat. A rugby player, or anyone three years into serious lifting, reaches a BMI of 27–29 at 12% body fat. The formula files them as overweight while they are metabolically healthier than most people at 22.
Understating it in older and sedentary people. After 60, muscle leaves and fat takes its place. The weight holds, the BMI holds, the composition changes entirely. There is a name for this — sarcopenic obesity — and it carries a worse prognosis than obesity alone.
Then there is a third group: normal weight, large belly. They are described as metabolically obese normal weight — BMI 23, waist 96 cm, insulin resistance and triglycerides in the range you would expect at obesity. BMI never sees them. A tape measure sees them immediately.
Читайте также: BMI and Body Composition: What the Index Shows and What It Misses
Accuracy of the circumferences decides everything: a 2 cm error at the waist shifts the estimated body fat by roughly a percentage point.
| What | Where | How |
|---|---|---|
| Waist | At the navel, standing | Morning, before eating, tape horizontal, do not pull the stomach in |
| Hips | At the widest point of the buttocks | Feet together, tape parallel to the floor |
| Neck | Just below the larynx | Tape angled slightly forward, shoulders relaxed |
| Height | No shoes, back against a wall | In the morning: you lose 1–2 cm by evening |
If everything sits in the healthy range: nothing. A stable weight and a waist that does not creep up year on year is itself a decent marker.
If the numbers are outside it, the direction is more useful than the value. A waist that dropped 4 cm over three months at the same body weight beats losing 4 kg of unspecified origin. That is why the calculator also shows fat-free mass index — it tells you how much muscle sits beneath the fat and stops you mistaking wasting for fat loss.
A scale that refuses to move while your waist shrinks is the normal course of events in the first months of resistance training, not a reason to stop.
Читайте также: Visceral Fat: Why It Is Dangerous and What Actually Removes It
It does not know your age in the sense of body composition — a BMI of 24 means different amounts of muscle at 25 and at 70. It knows nothing of ethnicity beyond the coarse Asian adjustment. It does not apply in pregnancy, in children and adolescents (who need age-specific percentile curves), in strength athletes, or in anyone with oedema or ascites, where retained fluid counts as body mass.
Above all: none of the four numbers diagnoses anything. Obesity is a clinical diagnosis, made alongside blood pressure, glucose, lipids and history — never from a single figure.
Читайте также: Health Check-ups by Age: Which Tests Are Actually Worth Doing
Divide your weight in kilograms by your height in metres squared. For example, at 70 kg and 1.75 m: 70 / (1.75 × 1.75) = 22.9, which is normal. The calculator above does this automatically and shows which category the result falls into.
The BMI thresholds for adults are the same regardless of sex: normal is 18.5–24.9. The difference lies elsewhere: at the same BMI women carry more body fat on average. So the body-fat and waist references differ by sex, while the index itself uses one shared scale.
Between 18.5 and 24.9. Below 18.5 is underweight, 25–29.9 is overweight, and 30 or above is obesity, split into three classes. For people of South and East Asian descent the cut-offs are lower — overweight from 23, obesity from 27.5 — because at the same index they carry more body fat and a higher risk of type 2 diabetes.
It counts kilograms without asking what they are made of. In someone carrying a lot of muscle a BMI of 27 is normal, not overweight. A sedentary 70-year-old with a BMI of 23 may hold more fat than a 30-year-old at 27. BMI works for populations, where these cases cancel out, and works poorly for the individual in front of you.
Waist. It reflects visceral fat — the metabolically active kind packed around your organs — and that is what drives insulin resistance, dyslipidaemia and cardiovascular events. In meta-analyses waist-to-height ratio outperforms BMI at predicting risk, and since 2022 it sits in the NICE guidance.
Under 94 cm for men and under 80 cm for women. Above 102 and 88 cm respectively marks high risk. There is also a rule that needs no sex or height adjustment: keep your waist under half your height. At 170 cm that is 85 cm.
The US Navy circumference method typically lands within 3–4 percentage points of DXA, and drifts further at the extremes. That is too coarse for a single verdict but fine for tracking: if the number falls over two months, your waist genuinely shrank. Only DXA gives you the absolute figure.
No, that is overweight. Obesity starts at 30. But landing in 25–29.9 says little on its own: the band holds both heavily muscled people and people with pronounced abdominal fat. What separates them is not BMI but a tape measure.
Probably — or more precisely, you should change your body composition. That combination is described as metabolically obese normal weight, and its cardiometabolic risk sits closer to overweight than to healthy. Work on the waist rather than the scale: resistance training and a modest deficit move it while your weight barely changes.
Where BMI came from, when it works and when it fails, why waist-to-height ratio beats it, and how to read your body composition without expensive equipment.
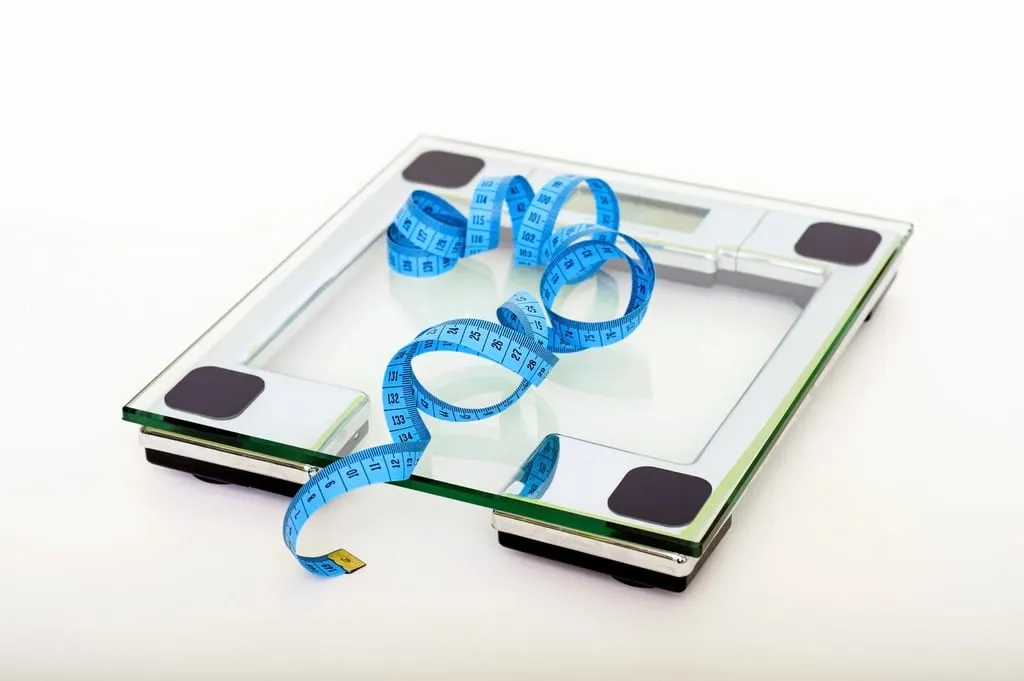
How visceral fat differs from subcutaneous fat, why it carries more risk, how to assess it without an MRI, and which changes to diet and training genuinely shrink your waist.

How to work out your maintenance calories, what size of deficit is safe, why tracked deficits often fail to move the scale, and the habits that hold.